Statistics
The essential
Statistics are available in Phraseanet. In Production, statistics on documents are available in a couple tabs in detailed view.
Report gives more detailed information on the site’s activity.
Statistics in Production
Statistics on the records are available in two tabs of the detailed view.
Timeline
Document’s statistics
Statistics in Report
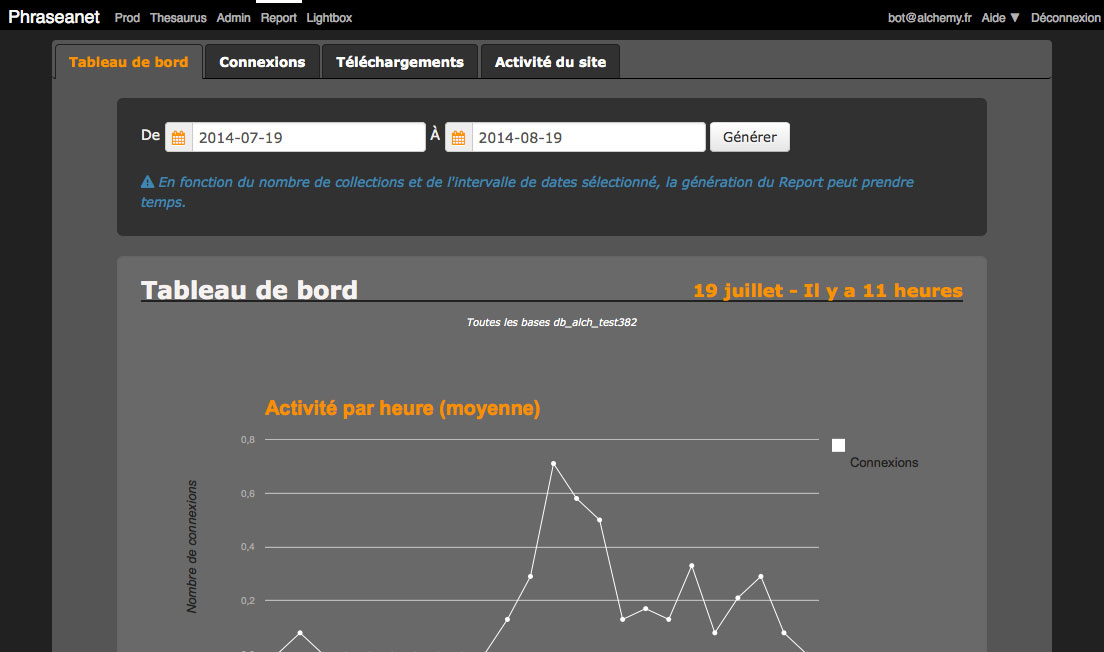
Report regroups the statistics on connections, downloads, and site activity. A dashboard sums up these main information.
To start a Report, click on the corresponding section in the menu bar then generate the report for a chosen period.
Dashboard

The dashboard gives general details about:
- The number of connections to the site
- Addition of documents
- Records edition
- The number of original documents download, of sub-definitions, and the bandwidth they represent on the network.
- The most active users (questions asked)
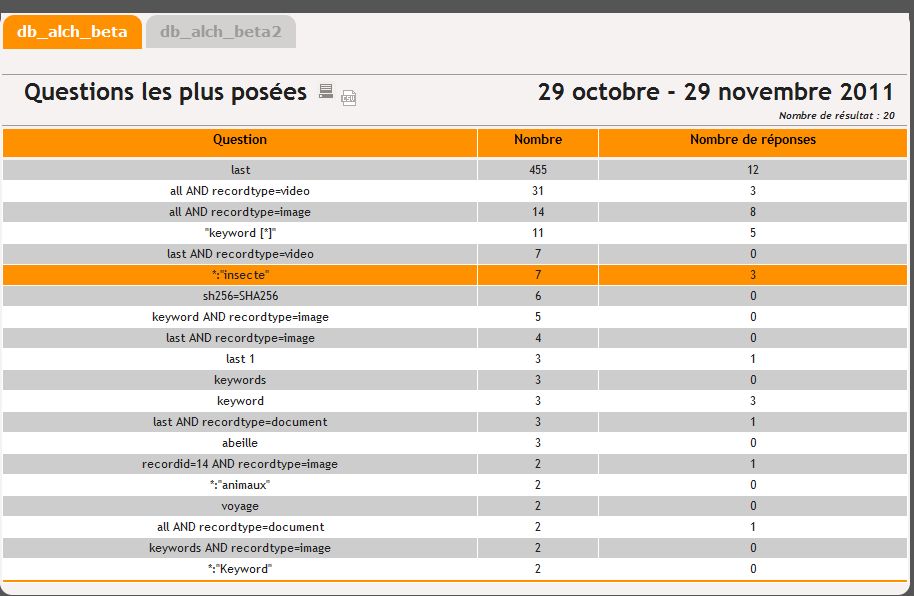
- The 10 top frequently asked questions
- The sites where the media are the most viewed
These statistics are detailed in the Connections, Downloads and Site activity tabs.
Connections
The Connections tab gives details about connections on Phraseanet instance. Three type of reports are available :
- The number of connections per user
- The connections history
- The details on platforms and web browsers used by the users
To generate these reports:
- Choose a period
- Select bases and collections on which the statistics are calculated
- Select a type of report
Note
Chosen dates are persistent from one tab to one other.
Downloads
The Downloads tab lists the downloads for a specified period, by bases and collections:
- By user
- By chronological order
- By day
- By documents of a base
Links on the infos in the RecordID column allows to display a note of the downloaded documents. This note contains:
- A preview
- Metadatas like the date of creation in the base, title or filesize
Click on the cross on the top right of the overlay window to quit the note and go back to the downloads list.
Site Activity

The Site activity tab regroups details on queries made during searches, connections during the last hours and activities on documents.
The reports are generated on demand after selecting date interval, bases and collections
Activity per hour (Site activity)
This report gives a graph of the number of average connections per 24 hour period in over the selected dates.
Documents
This report allows to get details of the activity of documents. A list of choices allows to choose the actions made on documents:
- Pushed documents
- Added documents
- Caption edited documents
- Feedbacked documents
- Documents sent to recipients
Note
A setting option allows to anonymize reports. In this case the account IDs do not appear in the generated reports. Refer to the Report display options section of the Admin Settings.
Customize and export reports
It is possible to hide the contents of columns in the generated reports. Click on the cogwheel to display the overlay window allowing to hide the contents of the columns.
Some column headers allows to sort if needed.
Most of the generated reports can be exported as PDF or CSV files. Click on the dedicated icons to export to obtain the reports in the desired format.
